
One of the big questions every quarter is whether or not Netflix will hit its quarterly subscriber growth estimate. This leaves analysts scrambling to read the tea leaves from app downloads and what not to try to figure out if they are on track or not. Tomorrow (Tuesday Oct 20th) will tell us one way or another.
My contribution to this is to note that often having valuable content drives adoption and usage, and hence subscriber growth. This sounds relatively benign, as a statement, but has profound implications for whether or not Netflix has a “moat”. Or indestructible defensive position. If Netflix is simply another content creator whose success depends on producing good content, well they’re as mortal as the rest.
So my data of the week is one look at content. There are lots of ways to do this (Hedgeye Communications used Google Trends to brilliantly show this in a newsletter last night), and the data set I’ve been playing with recently is Nielsen’s top ten streaming shows each week. Here is the total minutes viewed for Netflix from Nielsen by week for the United States from end of March to present, with a big gap:

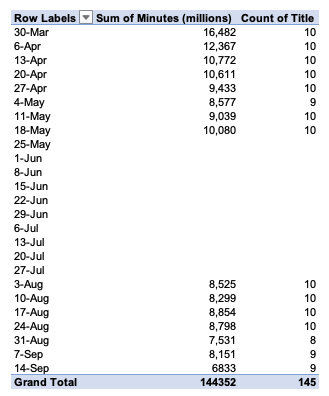
And here’s the table for folks who want the raw numbers. I also included how many titles they had in the top ten.
Ramifications/Thoughts/Insights
– Hits drive the ratings. Again, this is so obvious and has been true for decades it sounds silly to restate it, but in the “digitally disrupted” world, we have to relearn old lessons.
– Man, look at March! It turns out Tiger King and Ozark drove huge viewing to the platform. Almost 2.5 times more viewing to the top ten.
– Likely this means that content in Q2 was much more popular than Q3. Tentatively, this would portend a drop in US and Canadian subscribers in the next earnings report. (Some application sign-up and download data is presaging this outcome as well.)
– Yes, the last three weeks have seen 1 to 2 non-Netflix shows make the list, making this time series not totally apples-to-apples over time. That said, I ran the list with the Amazon and Disney shows, and it looks mostly the same. Meaning that the top 3-5 shows tend to account for most of the viewership, so having one or two small shows with 500 million minutes viewed doesn’t radically change the numbers.
– I have a ton to unpack for these Nielsen numbers to learn/prove more insights about how content behaves on Netflix and other streamers. (Trust me, I know a ton from my previous role about how the content behaves, but I want to show/prove it in the data. And for the most part, it behaves the way I expect.)
– Long term, I hope to compare Nielsen’s data to Netflix’s Top 10 data (provided by Flix Patrol) to Netflix’s own datecdotes to Google Trends and more, but that takes time. Also, if you have a data set you want to share, my email is on the contact page!
– Specifically, I’m on the look out for the missing weeks of top ten data from this Nielsen data set. Someone sent me the April and May numbers, I’d love to have March, June and July if anyone has them. Your confidentiality assured.
