
(This is a new feature from the Entertainment Strategy Guy. It’s a weekly “visual of the week” that will come out every two weeks. If you like it, consider sharing it on social media, just toss me credit.)
The big Netflix news last week was their earnings report. But the most fascinating story for a data wonk like me was Lucas Shaw’s scoop on the top Netflix films by viewership (2 minutes of a film) of all time. With this scoop, I’m up to 30 different “datecdotes” on Netflix film viewership over time.
This visual of the week has two different presentations. First, Netflix raw viewership overtime, by quarter:

(Details: This is by my estimates for 70% completion of a film by Netflix subscribers. This is global data. Time period is Q4-2018 to Q2-2020.)
Of course, that doesn’t account for the size of Netflix, so here’s the percentage of viewership:
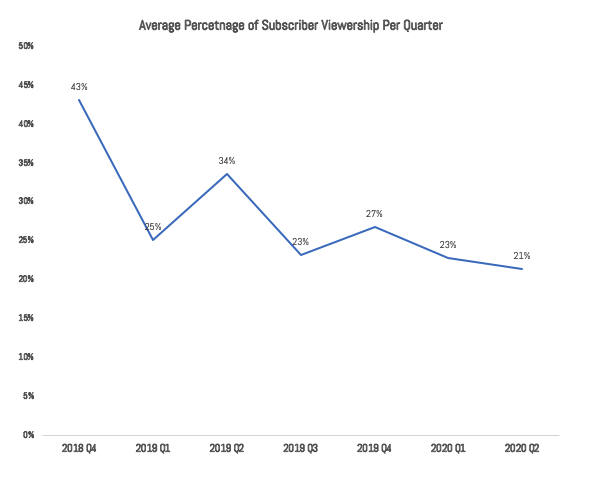
(Details: This is by my estimates for 70% completion of a film by Netflix subscribers divided by subscribers at the time. This is global data. Time period is Q4-2018 to Q2-2020. Constraint: Only films getting over 20 million subscribers are included.)
If you want more details on Netflix feature film performance, I started a big thread on it on Twitter.
1/ Time to dig deep into some Netflix data. #Netflix #Datecdote $NFLX @Netflix
A Thread on Netflix' Feature Film Performance
— The Entertainment Strategy Guy (@EntStrategyGuy) July 20, 2020
