
A character in The Sun Also Rises described going into bankruptcy as happening “gradually and then all at once.” This apt description has been applied to everything from debt insolvency to failed democracies.
The U.S. recovery from Covid-19 will likely feel the same way.
Right now, most of the coverage I read is fairly pessimistic and cynical. On one hand, I get it. The U.S. just had an awful winter. Covid-19 will claim 500,000 deaths in the U.S. alone, and that number is growing. Even positive coverage is framed with caution:


On the other hand, doesn’t the U.S. have a lot of good news on the Covid front? Is this pessimism still warranted? Forecasting doom and gloom could be as inaccurate as forecasting sunshine and roses. Where are we really headed as a society? Given the huge implications for the economy, this is a tremendously important question that very, very few people are answering:
When will society reopen after the vaccine rollout?
For my purposes, a lack of forecasting about the future is particularly painful. While lots of entertainment is consumed at home (TV, streaming, video games), lots more is experienced live and outdoors (theaters, concerts, sporting events, theme parks). As I usually do when I can’t find an answer to a question I need to know, I tried to answer it myself.
So here’s a report on what I found. The outline of this (long) article is roughly:
– Bottom Line, Up Front
– The Problem: the legal/regulatory thresholds for society to reopen
– The Assumptions/Inputs: the key assumptions/inputs to build a reopening model
– My Hypothesis: Effective vaccines widely distributed will crush the death toll
– The Model: My results!
– The Key Metrics To Track Going Forward
Let’s get to the results.
Bottom Line, Up Front
I’m optimistic that theaters will be open by May 7th across the US.., including New York and Los Angeles, the day Black Widow is set to premiere in the U.S. Black Widow itself may not premiere on that date, though whether or not it moves dates in the next few weeks will be driven by uncertainty, since Disney will have to make the call in about four weeks.
After building a vaccine distribution model (with three scenarios), I’m confident that by early May, between 33%-44% of the population will be fully vaccinated, and up to 61% will have had a first dose. Given the initial data that even one dose provides nearly full efficacy, this level of vaccination will likely decrease deaths and hospitalizations by 76% or more.
It is much more uncertain what the volume of cases will look like by May 7th. The key metrics to focus on, for studios and other entertainment companies, will be the pace of vaccinations, the current case loads, and the rate of death.
(Initially, I had a series of caveats to this controversial article. I can hear the skeptics, “You’re not an epidemiologist, so why should we listen to you?” To save space, I’m moving those to their own future article. To address the key caveat, yes, I’m not an epidemiologist.
Frankly, most companies cannot afford to hire epidemiologists to forecast disease outbreaks. And even if they could, as we’ll see, their models have their own uncertainty. Instead, many companies will likely have their strategy teams doing this analysis themselves and/or rely on models from companies like McKinsey/Goldman Sachs, which are, you guessed it, put together by people like myself. The difference is I make my models/methodology public.)
The Problem: When Will Theaters Open Specifically?
Today, I’m focused on the movie theater problem. (Hopefully, I’ll get to sports and concerts in future updates.) The problem for big studios is distribution: when they release a big tentpole film, they want it widely available. Specifically, this means Los Angeles and New York (and some other big cities). They’d ideally want theaters at 100% capacity, but would likely accept 50% capacity constraints.
Thus, the question is whether those specific cities (and America broadly) will be mostly reopen by May 7th, which is when Black Widow premieres. (Or Memorial Day weekend, 28-May-2021 when Fast 9 is set to premiere.) The studios will need to make this call about eight weeks prior, so that they can schedule promotional advertising campaigns. Disney has said they’ll likely make the decision on Black Widow in the middle of March.
To reopen theaters, local counties will need to have Covid outbreaks under control, using whatever guidelines local states have established. In California, for example, this is a series of “tiers”, of which Los Angeles is firmly in the first, most restrictive tier. From the Los Angeles Times:

And our status under those definitions:

(Though, like all things Covid-19, there is actually a more restrictive tier of “stay-at-home orders”. California’s stay-at-home order was lifted in January.)
Tying this to theaters, in California, “red/tier 2” counties can have theaters at 25% capacity or under 100 people, whichever is lower. “Orange/tier 3” counties can have 50% capacity or 200 people, whichever is lower. “Yellow/tier 4″ presumably would be fully open.
Covid Act Now uses a different set of guidelines, and you can see how various metro areas stack up:

No matter which numbers you use, the same basic correlation is the same: The lower the number of cases, the more indoor businesses which can be open, which includes theaters.
As cases decline, so do deaths, after about a three week lag. Crucially, as vaccines are widely distributed, deaths may decline even further and faster than cases. If deaths drop and stay low, even if cases come back, some folks could argue that the values of reopening society outweigh the risks of disease spread. (In short, if a pandemic is raging, but no one is dying, is it a pandemic?)
Really, there are two scenarios for reopening. One is the “public health” requirements, which means eradicating cases. The second is the “demand side” requirement, which is that deaths and hospitalizations are low enough that society wants to reopen.
The Key Assumptions/Inputs
The reason I couldn’t build a model before 2021 on Covid-19 was that forecasting the pace of the disease was nearly impossible. With so much uncertainty and unknown variables, most models have failed to effectively forecast what will happen in the next two to three months.
Vaccines, on the other hand, are an easier modeling challenge. We have fairly reliable data sets on distribution and fairly robust (and growing) knowledge about how effective they are. Let’s explain those inputs/assumptions.
Input 1: The pace of vaccination is increasing in the U.S. and could accelerate further.
No matter how you slice the data, the rate of vaccinations is growing in the U.S., and it’s a story that most outlets mention, but with the pessimistic caveat that everyone wishes they were even higher. (Yes, we do.) But they’re getting higher every week. In a few weeks, they will be shockingly high. Here’s Our World in Data’s look:

Or take Kevin Drum’s take, looking at peaks:

The U.S. was able to double vaccination capacity in ten days starting on January 4th (350K per day, seven day average) to January 14th (700K). I start with January 4th, since that’s when most healthcare workers returned from Christmas break, and all state and local governments focused full-time on the vaccination program. Then, it took 26 days to double again (from January 14th to February 9th). Depending on when we get to 2 million doses, it may have taken only 30 days to have doubled from 1 million doses to 2 million. (We’re currently at about 1.7 million per day.)
We will likely be delivering two million doses per day, as this week, the Biden administration committed to delivering 13.5 million doses to states at a minimum. On top of this, the Biden administration is delivering two million doses directly to pharmacies and one million doses to community health centers. If all those doses are used next week, we’ll exceed 2 million doses administered per day. Further, the CDC expects 200 million total doses distributed to states by the end of March, which implies a daily rate of 3.5 million doses per day in March.
Input 2: One Vaccine Dose Begins Providing Protection
The initial data from the UK and Israel shows that even one vaccine dose provides a high level of protection. This does not mean individuals shouldn’t get a second booster shot. They clearly should. Very likely, though, the first dose provides immediate impacts on infections, hospitalizations, deaths and even transmission. More and more data is coming out which supports this conclusion.
Input 3: The Covid-19 vaccines work. Extremely well.
It seems crazy to have to repeat this, but it should be noted that the vaccines work really, really well. You probably saw this tweet from Brown University epidemiologist Dr. Ashish Jha, but it’s worth repeating:
Am often asked about different vaccines and their efficacy
Each trials tracks, reports efficacy differently
Currently, we have preliminary results for Novavax and J&J
But what numbers matter? What should you look for?
Here's one set of data to track. In a simple table pic.twitter.com/9m2OBgqcla
— Ashish K. Jha, MD, MPH (@ashishkjha) February 1, 2021
Moreover, studies conducted in the United Kingdom and Israel on vaccine roll outs confirm the efficacy of these vaccines. In addition to preventing symptomatic illness, the vaccines also drastically reduce hospitalization and death. Finally, initial data also suggests that in addition to preventing death, it looks likely that the vaccines prevent transmission to other individuals.
Input 4: Covid-19 is most severe for older individuals, who the U.S. is prioritizing in the vaccine rollout.
While the coronavirus can and does kill all ages, one of the more clear trends is that the virus disproportionately kills older individuals. Here are a few looks at this:


Fortunately, in January, after vaccinating healthcare workers, the CDC changed guidance to focus on high-risk (meaning older) populations. This means the impact of effective vaccines will be even greater than general distribution because it will decrease hospitalizations and deaths of those most likely to be hospitalized and die.
If we can achieve high levels of vaccinations in those groups (say 80% of a given age population vaccinated), then the results will be dramatic. Vaccinating 80% of individuals over 75 will lower total deaths by 48%, individuals over 65 will lower deaths by 65% and vaccinating individuals over the age of 50 will lower total deaths by 76%. (And if we can achieve 100% vaccination in the most at risk groups? We’d lower total potential deaths 95%!)
Input 5: The current lockdowns are having a dramatic effect.
Meanwhile, as the Covid Tracking Project’s data show, the number of cases are plummeting in America. The declines are dramatic:
![]()
Whatever the cause—lockdowns, seasonality, growing natural immunity, some vaccine prevention—this is very good news for the United States. It means cases are trending down, right when vaccine distribution is ramping up.
Input 6: Case rates by population
To understand the impact on cases, beyond deaths, it is important to know how cases are distributed in the population. Unlike deaths, cases are fairly well aligned with the population. Meaning, folks will test positive for Covid-19 roughly correlated with their percent of the population.

This is important because it could mean that as vaccines are rolling out to younger populations, the case rate could flatten or even increase, but deaths will not. There is already evidence that case loads are dropping in certain age groups in the UK, Israel and the U.S., but as you can see, that may not impact the overall case load significantly.
My Working Hypothesis
Add these inputs together, and this is my working hypothesis:
If current lockdowns can drive down cases…
Which will drive down hospitalizations/deaths…
And if the United States can vaccinate the highest-risk groups…
And if we can continue to increase the vaccines distributed per day/week…
Since vaccines prevent deaths and hospitalization…
Then once we get the current hospitalization rate down, it will stay down until the next flu season (next November or December). If hospitalizations are down, deaths will stay down as well.
This will allow states to reopen, including theaters.
The Model
So that’s the working theory. Let’s turn this into a model.
Step 1: Vaccine distribution
To start, I sketched out some vaccine distribution scenarios. To start, I drew a linear model in vaccine distribution to see how it was growing. Then, I made a simpler second model based on potential vaccine supply. This weekly model uses big round numbers, but is more aggressive than the linear model and based on CDC guidance about distributing 200 million doses by the end of March. Lastly, I made a very conservative model based on plateauing vaccine supply at 2 million per week starting in February.
First, here’s the linear model to show the logic:

Here’s the table of doses by week:

And a chart of that…

That’s a lot of numbers, so here is a summary by month of the “reasonable” model.

The monthly model confirms that vaccine makers could indeed hit the aggressive targets. I built the conservative model based on misreading the director of the CDC, Rochelle Walensky, estimating that we’ll have 200 million doses by the end of March. (I thought she had said 200 million by the end of April.) At a rate of 200 million doses by the end of March, the CDC is basically forecasting that we’ll be vaccinating 3.5 million people per day at some point in March. That’s my “reasonable” but aggressive model.
Step 2: The number of vaccinated individuals
So that’s the first step. We can reasonably forecast how many doses we’ll have distributed by future dates. Yet, some folks will insist on distinguishing between shots and those who’ve been fully-vaccinated. I went further and also calculated those who will be two weeks from their first dose, since data shows this too provides quite a bit of protection. Specifically, we need to know these dates by the start of May, our presumed launch of Black Widow.
Here is my rough counts for those, and to put them into context, the percent of the population over the age of 18 who would be covered:


(Why over 18? Because the vaccine is only approved for those 16 and over, and Covid-19 has very little impact on ages younger than that. Plus, frankly, it is about 250 million individuals, which is a nice round number.)
In the worst case scenario, by the time Black Widow premieres, only 30% of the population will be fully vaccinated.
However, in the best case scenario, if you include natural immunity, one-dose vaccines and count folks who are two weeks from their first shot, then up to 69% of the population will have immunity to Covid-19. So we’ll be on the verge of herd immunity by the end of April!
Let’s be clear on these assumptions:
– Some portion of Americans have already had and recovered from Covid-19, acquiring natural immunity to it. This floor is at least 27 million confirmed cases. (About 10% of the population.) The high end is unknown, but Harvard epidemiologist Michael Mina’s forecast is 40%. Let’s split the difference and call it 20%.
– I used the date five weeks prior, since Moderna is three weeks, then two weeks to be fully effective. Yes, Pfizer is four weeks, but again, this difference is minimal overall.
Step 3: The number of deaths prevented
Again, the impact of Covid-19 is not equal across the population. It is very much tilted towards older individuals. Meaning, when they are vaccinated, the odds of dying from Covid-19 decease by 92% or more.
To figure out how to vaccinate the right folks, I simply took the CDC data and 2019 census information, and assumed an 80% vaccination rate:

In other words, to prevent 76% of deaths, we need to vaccinate 80% of everyone over the age of 50. The key assumption is that we can achieve 80% full vaccination by group. Most surveys put vaccine hesitancy at 70% of the population, but only about 10% is hardcore obstinacy to any vaccine. So I took a number in the middle.
So how many people do we actually need to vaccinate to get to that 3/4th decrease in total deaths going forward? Well, here you go:

Of course, not all doses will go to healthcare workers and individuals over the age of 65, especially as counties and states begin vaccinating more essential workers. (Like Los Angeles, who is moving onto food workers, teachers and remaining public safety officials after those older than 65.)
Given the vaccination rates above, we can see that it is very, very likely we’ll have fully vaccinated 40% of the population with either one or two doses, including most healthcare workers and folks over 65. A big portion will also likely be those 50 to 65. If we include people getting only 1 dose of Johnson & Johnson, then we’ll almost certainly have vaccinated all high risk groups.
My model forecasts that by May 7th, we’ll have lowered the ceiling of potential deaths by 76%. If this widespread vaccination results in decreased case loads and transmissions, the actual death rate could be much, much lower. This is essentially the “ceiling” of deaths.
Step 4: The Los Angeles-specific model
This model, so far, has only addressed vaccinations and deaths. What about cases?
As I set up in the problem, the primary criteria to release Black Widow (and other big studio films) in theaters is whether or not the coastal cities are reopened. To answer this, ideally, I’d build a model forecasting cases in both of those cities. Given that I live in Los Angeles, I pulled the numbers there to see how far LA is from reopening. I’m assuming that Los Angeles and New York are roughly correlated with each other, and their outbreaks are also roughly correlated with national outbreaks.
(This assumption is both fine and could be horribly wrong. The “summer surge” mainly took place in “Sun Belt” states, whereas the first surge took place in northeastern states. However, the last surge took place in every state simultaneously.)
I showed Los Angeles’ current performance on state re-openings, but it’s worth noting that most metrics are tied to case loads. If it goes down, ICU capacity, case positivity rate and the equity will trend downward as well. Here’s the current case trend line:

Now, the question is, can we model how vaccine distribution could impact case levels going forward?
And no, I don’t think we can.
I’ve done a lot of forecasting so far, but every number is from a fairly reliable source. The vaccine distribution plan is fairly well-reported, and its growth is easy to forecast. (Again, look at that straight line!) The impact of the vaccinations is also fairly well-known. Thus, we can confidently predict a coming drop in deaths that will stay low, if we vaccinate the most at-risk groups.
Cases, though, are a different ball game.
Just look at U.S. trendlines in the past. If you started in the middle of October and just extrapolated forward, you’d have missed the December spike. Or if you started in the middle of January, you’d have forecast cases to stay high. This actually happened with the CDC forecast. In the middle of January, their model of models forecast 1.5 million cases by the middle of February, with a floor over a million.

Instead? Cases are currently at 600K and falling.
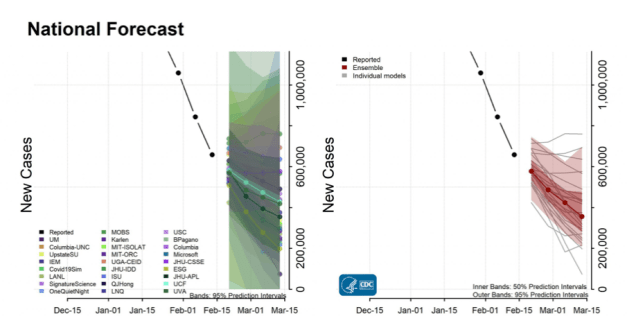
I don’t blame the CDC. Modeling seasonality, societal behavior and mostly a brand new virus is incredibly tricky, and these epidemiological models have trouble with it. Again, no blame here from a fellow modeler. I’m just acknowledging the limitations of modeling.
Add it up, and I won’t forecast the case rate/total cases in Los Angeles by the beginning of May. There are too many unknown variables. Indeed, I think both the best case (cases stay very low, due to natural immunity and expanding vaccinations) and the worst case (case rates rebound after widespread reopening, potentially driven by more transmissible variants) are both possible by May. The only thing I am fairly confident (as steps one though three show) is that deaths will stay down.
At best, what we can say is that as vaccinated rates go up, the peaks of the worst metrics will be limited. Think of it like this: the infection rate is the number of people an individual with symptomatic Covid transmits it to. If it is 2.5, that means one individual gives it to 2.5 individuals. If half of all the people someone meets are protected from Covid-19, then the max number would now be half of that, or 1.25.
The Key Metrics Going Forward
Notably, I haven’t provided any probabilities thus far. If I apply probabilities to events two months out, my error bars would need to be very, very wide. Those probabilities wouldn’t be worth much more than guesses.
Instead, I’m going to provide a scorecard of key metrics. The higher the scorecard, the more confident we can be that society will return to normal. You can apply your own probabilities based on the numbers. These metrics will have three parts: vaccinations, deaths and case loads.

I plan to think on these metrics a bit before I do an update, hopefully next week. As I said, I won’t provide predictions, except for the vaccine rollout, but will color-code which metrics are moving in the right directions.
As I said at the start, if you read all the way down here, as vaccine distribution picks up, the Covid-19 pandemic will end gradually, then all of a sudden.
In the meantime…
Please do whatever you can to prevent the spread of Covid-19, focusing on the best practices at preventing spread.
1. Wear a mask. In fact, wear two of the highest quality you can afford.
2. Avoiding indoor gatherings until you are fully vaccinated.
3. By all means, get vaccinated as soon as you are able to.
4. Help older relatives get their vaccinations by whatever means necessary.
5. Spread positive news about the efficacy and safety of vaccines and that they will enable our society to reopen. Vaccine hesitancy is driven by vaccine skepticism, a large amount of which is coming from the media. This includes skepticism about how vaccines prevent hospitalizations and death. Do your part to spread the good news and not Covid-19 hysteria.
Sources
I linked to most data I used to put this together. However, a few websites provide regular updates. I recommend…
– Our Wold in Data
– Covid Act Now
– The Covid Tracking Project
– The Los Angeles Times
– Bloomberg Vaccine Tracker
– Nate Silver’s Twitter feed, who close followers will recognize a few tweets from.
